
← Back to Results
BTCUSD
Sell
• TP Hit
• Updated 3 months ago
Description
BTC/USD Technical & Fundamental Outlook
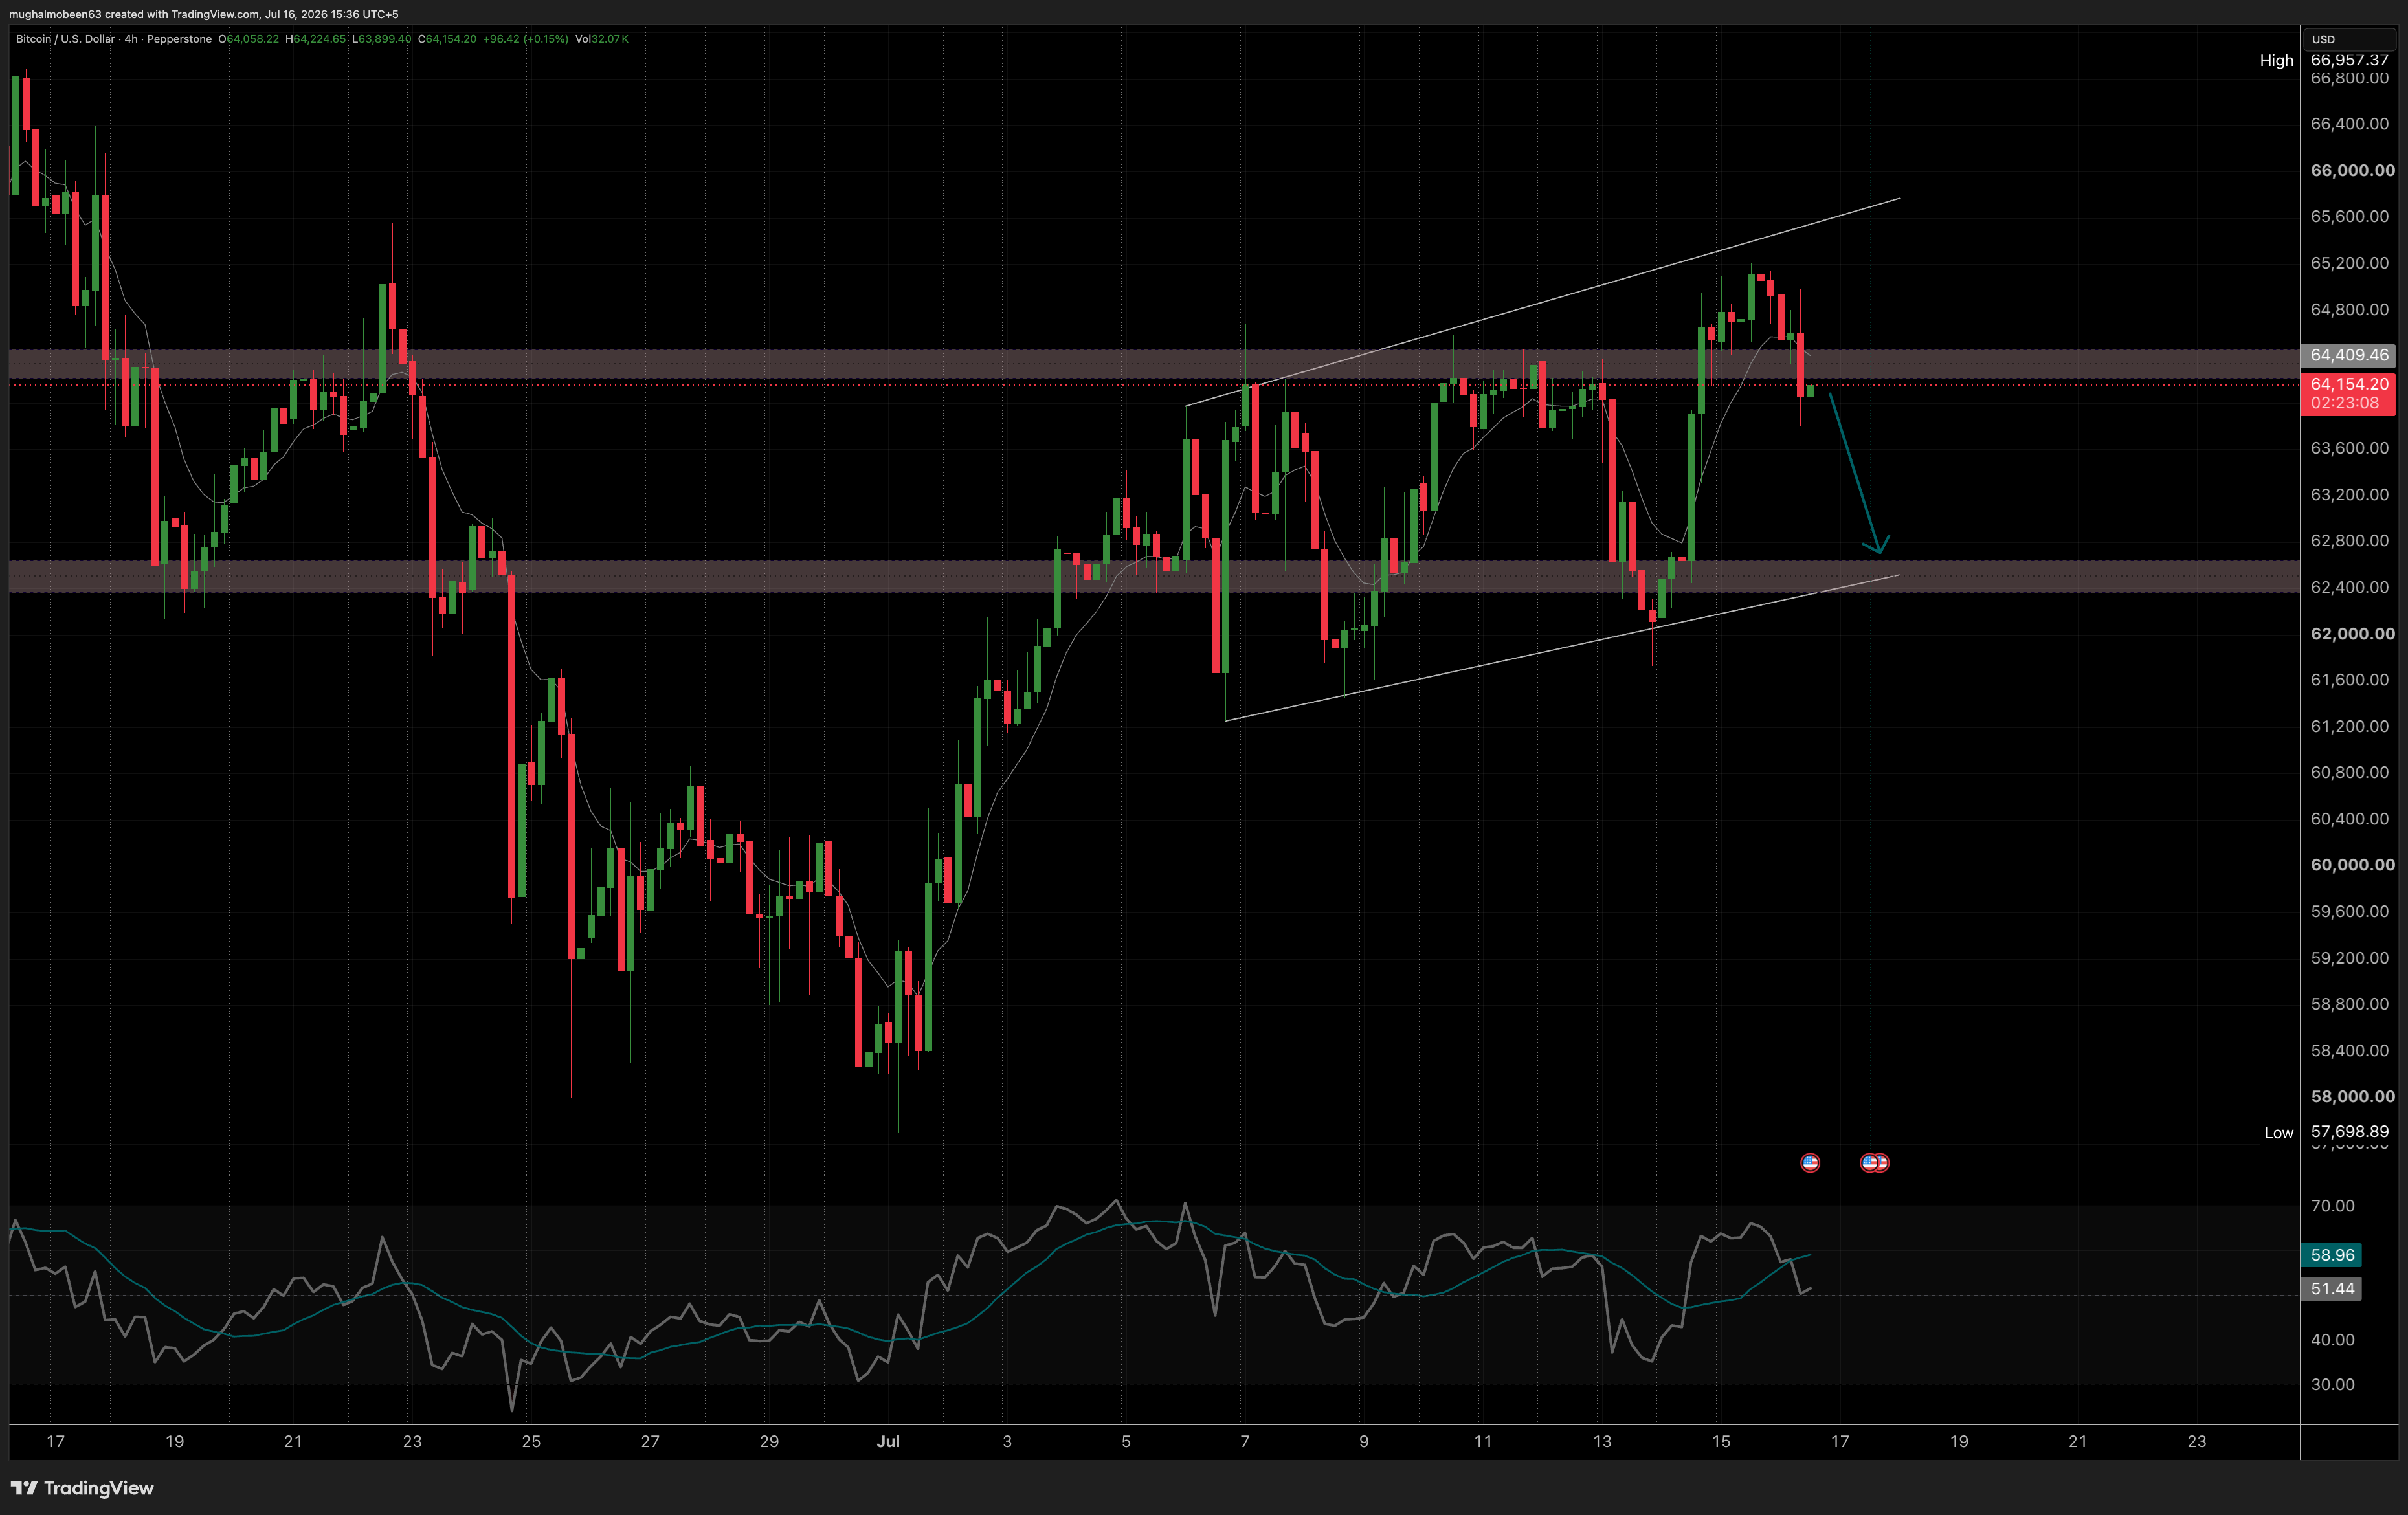
Technical: BTC is trading at $64,154 on the 4H chart, inside a broadening/rising wedge. The upper trendline connects swing highs near 65,600 and 65,900 (July 5 and July 15), while the lower trendline connects swing lows near 61,600 and 62,400. Price rallied off the June low (~57,700) to a high of 66,957, then stalled and rejected off the upper wedge boundary near 65,000, sliding back below the key 64,409–64,800 supply zone that has repeatedly acted as a pivot.
Williams %R is rolling over after a sharp spike into the July 15 high, signaling fading momentum consistent with a retracement toward the lower wedge boundary. Price has also started closing below the short-term moving average, an early sign the trend is shifting from bullish to neutral/bearish.
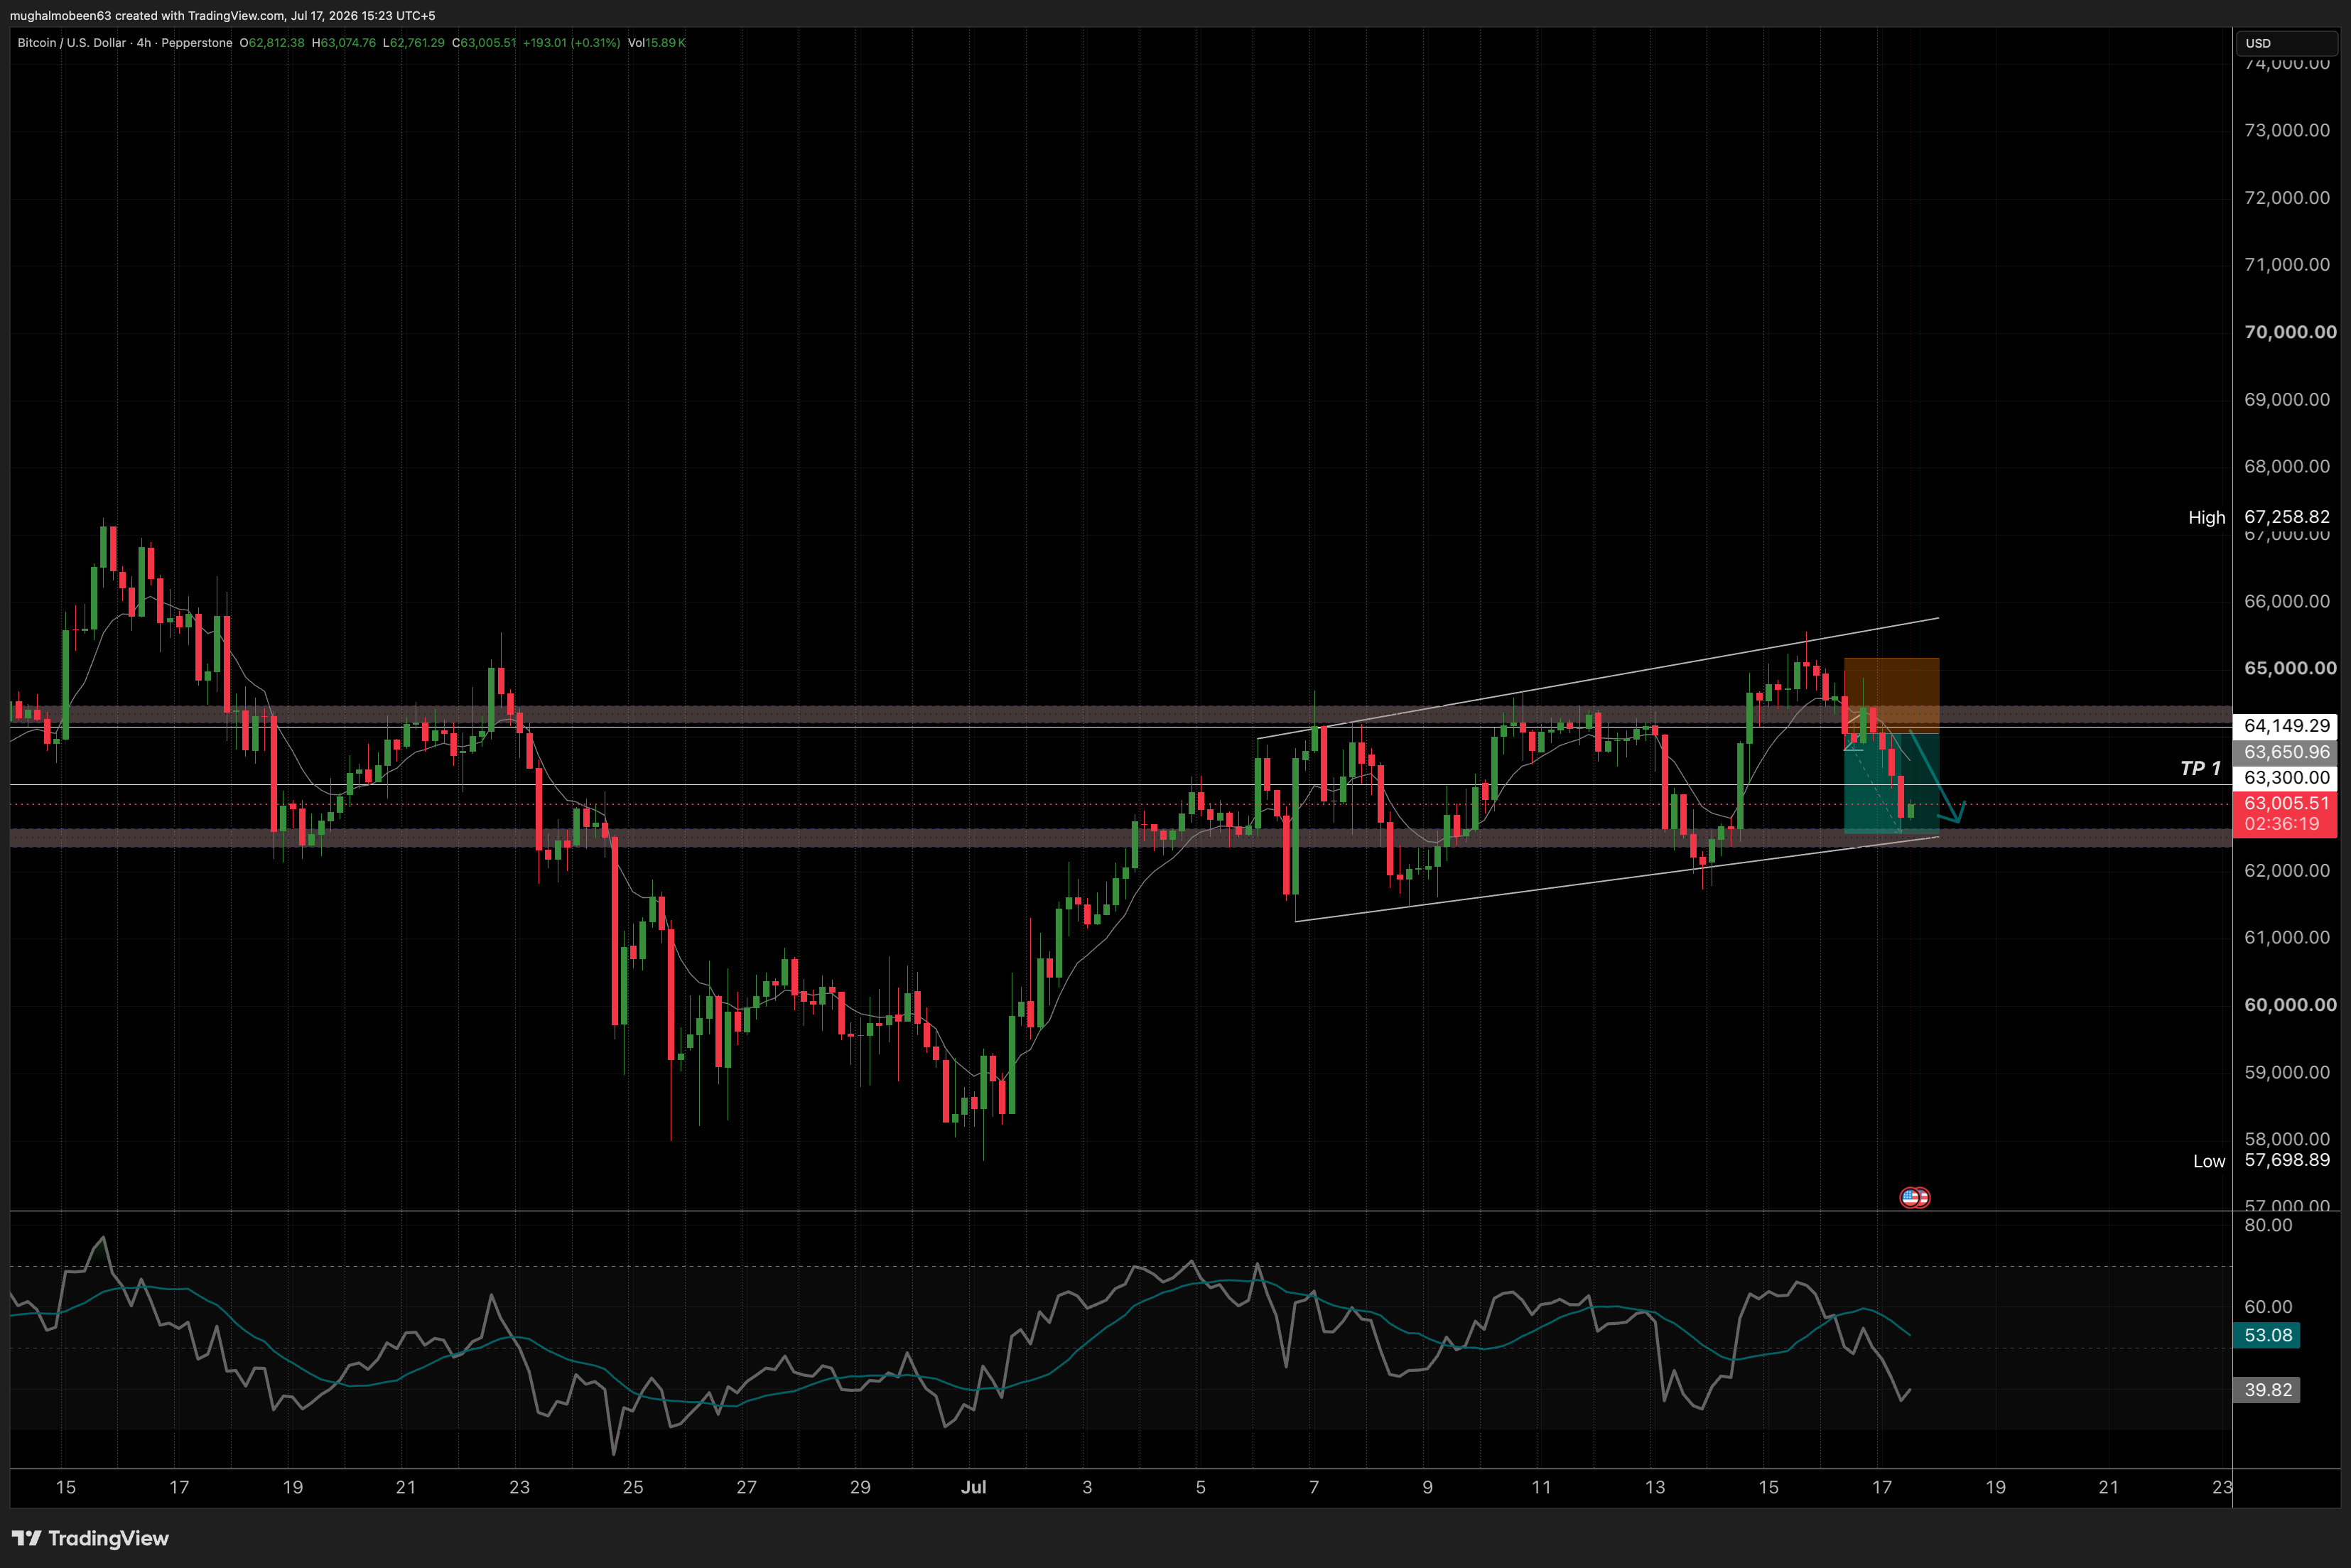
Key levels: resistance sits at 64,409–64,800; a consolidation below the 64,000 trigger would confirm bearish continuation toward Target 1 at 63,000, with Target 2 at 62,600 (lower wedge trendline). The broader range remains 58,000–67,000, with a weekly close below the 200-week MA in late June marking the first such break since 2023.
Fundamental: The Fed is the dominant driver. New Chair Kevin Warsh held rates steady in June and removed the priced-in rate cut, triggering the slide from the low $70,000s toward $60,000. Markets assign ~70% odds to another hold at the July 28–29 FOMC meeting, with the tail risk skewed toward a hike, offering little near-term relief.
ETF outflows have been historic: roughly $4.5 billion pulled in June, Bitcoin ETFs' worst month on record, concentrated mostly in BlackRock's IBIT. At least one major bank cut its 12-month inflow forecast to zero. Since ETF flows translate to real spot selling, this represents actual supply pressure, not just sentiment. Still, retail has stayed relatively calm, and corporate buyers like Strategy (holding ~843,775 BTC) have kept accumulating — this looks more like institutional repositioning than panic.
Geopolitical tensions tied to renewed Iran-related escalation have added intermittent risk-off pressure, dragging BTC back from bounce attempts toward $64,500 on several occasions.
Net read: Technical and fundamental pictures align for now — wedge rejection, fading momentum, a hawkish Fed, and bleeding ETF flows all support a corrective slide toward 63,000–62,600 if 64,000 fails to hold. The July 28–29 FOMC meeting is the key catalyst likely to resolve the broader 58,000–67,000 range, with a reversal in ETF flows being the clearest early signal of a genuine bottom.
Not financial advice — informational purposes only.
Technical: BTC is trading at $64,154 on the 4H chart, inside a broadening/rising wedge. The upper trendline connects swing highs near 65,600 and 65,900 (July 5 and July 15), while the lower trendline connects swing lows near 61,600 and 62,400. Price rallied off the June low (~57,700) to a high of 66,957, then stalled and rejected off the upper wedge boundary near 65,000, sliding back below the key 64,409–64,800 supply zone that has repeatedly acted as a pivot.
Williams %R is rolling over after a sharp spike into the July 15 high, signaling fading momentum consistent with a retracement toward the lower wedge boundary. Price has also started closing below the short-term moving average, an early sign the trend is shifting from bullish to neutral/bearish.
Key levels: resistance sits at 64,409–64,800; a consolidation below the 64,000 trigger would confirm bearish continuation toward Target 1 at 63,000, with Target 2 at 62,600 (lower wedge trendline). The broader range remains 58,000–67,000, with a weekly close below the 200-week MA in late June marking the first such break since 2023.
Fundamental: The Fed is the dominant driver. New Chair Kevin Warsh held rates steady in June and removed the priced-in rate cut, triggering the slide from the low $70,000s toward $60,000. Markets assign ~70% odds to another hold at the July 28–29 FOMC meeting, with the tail risk skewed toward a hike, offering little near-term relief.
ETF outflows have been historic: roughly $4.5 billion pulled in June, Bitcoin ETFs' worst month on record, concentrated mostly in BlackRock's IBIT. At least one major bank cut its 12-month inflow forecast to zero. Since ETF flows translate to real spot selling, this represents actual supply pressure, not just sentiment. Still, retail has stayed relatively calm, and corporate buyers like Strategy (holding ~843,775 BTC) have kept accumulating — this looks more like institutional repositioning than panic.
Geopolitical tensions tied to renewed Iran-related escalation have added intermittent risk-off pressure, dragging BTC back from bounce attempts toward $64,500 on several occasions.
Net read: Technical and fundamental pictures align for now — wedge rejection, fading momentum, a hawkish Fed, and bleeding ETF flows all support a corrective slide toward 63,000–62,600 if 64,000 fails to hold. The July 28–29 FOMC meeting is the key catalyst likely to resolve the broader 58,000–67,000 range, with a reversal in ETF flows being the clearest early signal of a genuine bottom.
Not financial advice — informational purposes only.